By Sertalp B. Cay | May 12, 2021
This season certainly proved how random FPL could get, full of difficult decisions and regret. Every GW, we’d look at our team and wish that we’d that shiny player everyone else had. Sometimes Bruno, sometimes Gundogan, and sometimes Martinez. Week after week we were filled with regret after not buying (or worse: benching) that player. Of course with hindsight being 20/20, it’s easy to see what you missed.
But what if you could get the ‘Almanac’ just like in Back to the Future 2 and know how every week would play out? You might think it could make your life easier, but that’s not entirely correct.
Here is the bad news. When considering FPL as a full-season problem with exact outcomes, it is still a very difficult mathematical problem to solve. Just consider the tremendous number of decisions you have to make every gameweek: Choosing 15 out of 600 players, selecting 11 of them for lineup, captaining one, using chips while limiting players from each team, keeping a non-negative ITB, etc… All of these rules snowball into one another, forming an increasingly complex tree of dependencies. Even if we were only to consider the simplified problem of choosing 15 players out of a set of 600, it gives more than 3 x 10^29 possibilities (300 octillion).
The good news is that after solving the problem to optimality (which we do below), we can apply some of what we’ve learned going forward. Note however that even with this gained insight, directly translating this optimal play into an actual strategy is still challenging. That’s what makes FPL’s overall difficulty such an interesting problem to solve.
There are some surprising results below. You will see that even a ghost ship team could finish the game at a really good rank.
Motivation
I started playing FPL this season (2020-2021) and have to confess that after hearing that a Math Postdoc had won it the year before was a huge motivation. Joshua Bull (Oxford Math Postdoc) winning score last season was an amazing 2557 points.
Following end of season checks, final standings have been updated. We can confirm that Joshua Bull is the official 2019/20 #FPL champion.
— Fantasy Premier League (@OfficialFPL) August 11, 2020
Congratulations @JoshuaABull 👏 pic.twitter.com/KsRO8yIi9W
So, obviously math is certainly helpful when it comes to formulating a winning strategy.1
I’ve been playing FPL entirely based on optimization for forecasted points, but a question asked to Joshua brought new challenge for me:
@JoshuaABull Is it possible to compute the best performing team of the whole season, following the rules of FPL with a "simple" level of complexity? Or is this optimisation problem not feasible?
— Jamie North (@JamieNorth_NRG) March 16, 2021
Yes! It is easy to write the model, and it is a feasible problem. But, it’s still a really difficult one to solve. I have never tried solving the previous season before. I wasn’t sure about what to expect out of it, although it certainly sounds like an intriguing problem.
Entire FPL season as an optimization problem
Ok, moving on to the juicy part. Feel free to skip to the results if you are not interested in the mathematics of the methodology.
I have mentioned this a few times already, but there is a great FPL optimization model that I’ve followed since the beginning of the season2.
The model considers the following:
- Squad selection
- Lineup selection
- Transfers
- Transfer Hits
- Chips
- Captain & Vice-captain
- Bench order
I won’t repeat the entire model here but here’s an example how the model works. Consider the FPL rule that states that you need to pick 11 lineup players. This number becomes 15 when you are on Bench Boost chip.
We have a variable for lineup $y_{pt}$ that shows whether player $p$ is in our lineup at gameweek $t$ or not. This variable is binary, meaning that it takes value 1 if a player is in our lineup, and takes value 0 otherwise. Using this variable, you can write the following constraint:
$$ \sum_{p \in P} y_{pt} = E + \phi b_t $$
Here, $P$ is the set of all players, $E$ is the number of players in regular lineup (11), $\phi$ is number of bench players (4), and $b_t$ is a decision variable that shows whether we are on Bench Boost chip at GW $t$ or not. Our lineup count, sum of all $y$ variables, should be equal to $11 + 4 \cdot b_t$ for every GW.
This constraint can be written in SAS OPTMODEL language as follows:
var Lineup {PLAYERS, GAMEWEEK} binary;
con StartingLineupLimit {t in GAMEWEEK}:
    sum{p in PLAYERS} Lineup[p, t] = lineupLimit + benchLimit * BenchBoost[t];
The entire FPL problem can be represented in this form. Finally, we obtain a a mixed-Integer linear optimization formulation that can be solved to optimality.
To solve this problem, I used SAS Optimization and ran the model through Python using the runOptmodel CAS action.
Differences compared to regular FPL problem
Our problem is a little bit different than the regular FPL model because once you know the exact outcomes you don’t need to model vice-captain. Also, bench order doesn’t matter. What we need to do is to ensure that we are, one, maximizing total points, and two, satisfying the FPL rules. So the main challenge here is to run model for the entire 38 GWs (instead of 8 GWs as I do for my team) and making sure that all the constraints are followed.
Objective, for example, can be written as
$$ \text{maximize: } \sum_{p \in P} \rho_{p,t} (y_{pt} + f_{pt} + 2 c_{pt}) - R \sum_{t \in T} \alpha_t$$
Here,
- $\rho_{pt}$ is the points player $p$ received on GW $t$,
- $f$ is a binary decision variable whether we captain player $p$ on GW $t$ or not,
- $c$ is binary decision variable for triple captaincy,
- $R$ is the points we lose for each hit (4),
- $\alpha_t$ is the number of penalized transfer in GW $t$.
This is how the objective is represented in the model:
max FPLObjective =
    sum {p in PLAYERS, t in GAMEWEEK} (points[p,t] * (LineUp[p,t] + Captain[p,t] + 2 * TripleCaptain[p,t]))
    - (penaltyTransferPoints * sum{t in GAMEWEEK} PenalizedTransfers[t]);
One important aspect we added on top of the base model was the transfer/profit logic. In FPL, you only get half of the profit (rounded down) if you sell a player for a higher price than you bought. So, we had to locate exact GW when a player is bought and sold. For 600 players, you can buy a player anywhere between 38 GWs and sell anywhere in between as well. This change also brings a plethora of new variables.
Note that, we had to make an assumptions to simplify transfer prices. In FPL, you can buy players cheaper before the price update (which happens every night). We assumed that the optimal policy can buy players cheaper (or sell for higher) by transferring them at the ideal time between two deadlines. This might not be possible in reality because you have to buy and sell at the same time.
Resulting problem
The resulting problem is simply massive. We have over 625,785 binary variables and 116 integer variables.
Optimization solvers can detect certain structures and drop variables and constraints (e.g. a player has 0 points entire season). In this case, however, even after initial presolve, we ended up with 575,425 variables.
I omitted some parts of the optimization model, but the code is available on GitHub if you want to have a look.
Experiments and Results
After Jamie’s initial question to Joshua, I learned that The FPL Kiwi gave this problem a try and reached 4889 points… By hand! Very impressive.
Fair warning there are very few formulas here, 'twas mostly done/checked by eye 👁️... May I present the 4889-point (!) season 🔢:https://t.co/dCMvrjzJJi
— The FPL Kiwi (@theFPLkiwi) August 23, 2020
Data source @vaastav05: https://t.co/sDeiLZj38B
Probably room for improvement, didn't know what budget I'd accumulate 👊🥝. pic.twitter.com/BDf8DTmdC0
Thanks to this earlier work, it was quite easy to find the input and we had our initial benchmark! (Also thanks to Vaastav Anand for collecting all data on GitHub for everyone to use 3).
I took this problem as a challenge and started talking with Kiwi and Wee Rogue on the optimization part. I should offer my personal thanks to Kiwi here who did an awesome job of spotting numerous bugs after I generated optimal solutions.
Following several iterations, we reached the final version of the FPL problem as a mixed-integer optimization model. The model is solved under a few different settings as we explain below.
Model 1 - Regular
The first model we have is the regular one, without any restrictions. This is the full model that can perform transfers and can take as many transfer hits as it needs.
The total points this model accumulated is… (drum roll please)…
4984
So, it was technically possible for someone to finish 2019/2020 season with 4984 points. If you voted on the Twitter poll I ran earlier, the answer to the first question was C (third popular choice!).
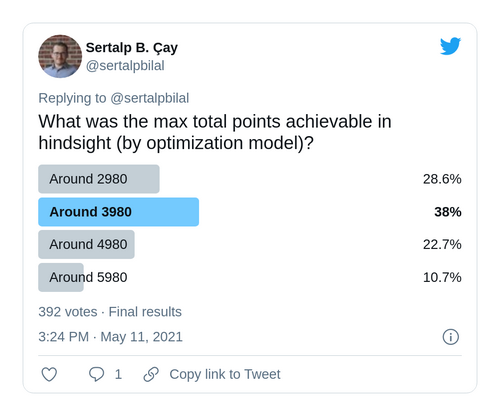
You can find the full solution on GitHub.
For optimization folks, I should mention that we terminated the solver after 4 days at objective 4983 with a gap of 1.09% (5038 upper bound). Kiwi pointed out a replacement during Free Hit to gain 1 more extra points, which gave us the final solution.
Here are some visualizations of the solution:
As you see, we have several GWs over 100 points, and the lowest point we received was in GW36. We haven’t included the number of hits in this plot, but in total model took 145 hits! The highest number of hits it took was GW11 with 7, meaning -28 points should be added for the net GW points.
Notice that an extra WC was available on GW30.
The model buys and sells so many players that we only listed top 25 players here. As you might expect, captain selection is all over the place.
In the tree-map plot above, you can see that majority of points come from midfielders (2019). Defenders (1303) and forwards (1174) provide quite a significant amount as well. We seem to get slightly less than 10 pointer per GW from our goalkeeper selections.
If we classify players by their price4
| Position | Budget | Mid-price | Premium |
|---|---|---|---|
| Goalkeeper | <5 | [5, 5.5) | ≥5.5 |
| Defender | <5 | [5, 6) | ≥6 |
| Midfielder | <7.5 | [7.5, 10) | ≥10 |
| Forward | <7.5 | [7.5, 10) | ≥10 |
we get the following distribution for transfers in the optimal solution.
Apparently budget and mid-price transfers are more common for model to perform. Note that Wildcard transfers are included here.
Model 2 - No Transfer Hits
A question I received was about finding the maximum number of points a manager can collect without taking any transfer hits. This question makes quite a bit of sense as normally, optimal strategies avoid hits when using prediction data.
I ran this version of the model for 18 hours. At the time of termination, solver reached 3945 points.
Note that the theoretical upper bound in this case is 4662 (15.39% gap), so there might be a better solution than this one. You can see the solution on GitHub.
Here’s where points come from for every GW:
As we are limited with 1 or 2 transfers per GW, points we collect are much lower compared to first model. The lowest number of points that we received is in GW15 with 62 points, and the highest in GW35 with 163.
Players obviously stay for longer time periods in this version. TAA, Martial, Van Dijk are some of the players who never leave the squad. You can easily spot the time Fernandes enters the squad at GW26.
The majority of points still come from midfielders, but figures are closer this time.
Finally, we can see that budget and mid-size transfer ratios are still the same, although this model transfers more defenders than the first model.
Model 3 - No Transfers
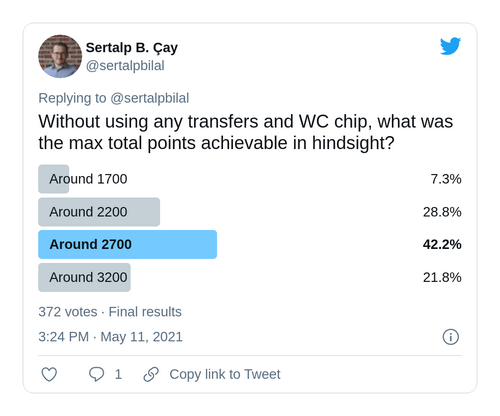
Another interesting question: What’s the maximum number of points you could have collected by not using any transfers at all? You can only replace squad members using FH chip for a single GW. Hence, WC chip is disabled.
The points such a team could collect is 3236. So yes, it was possible to win FPL last season by using the same squad for every GW and only changing your captain and lineup.
Solver reached this solution under 6 minutes and has a proof of optimality. Unless there is a problem with input data, this solution is the best one can get.
In this case, the correct answer to my poll was D, around 3200 (Again, the 3rd popular choice)
The solution is available on GitHub.
We get our lowest point at GW28 with 40, and the highest is at GW5 with 152.
As you see, except GW5, while using FreeHit chip all the players in the squad remain the same. KDB’s contribution is more significant in this case.
Model 4 - Ghost Ship Team
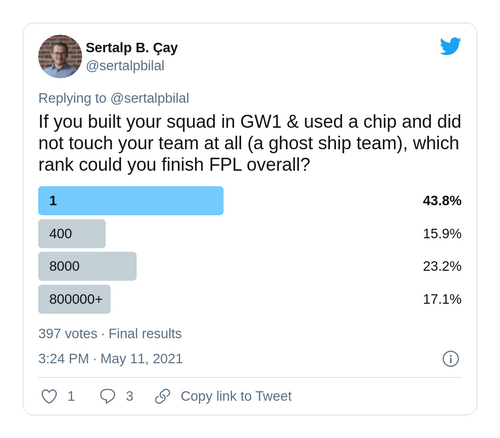
Let’s go wild: Use the exact same team, lineup and captain for every gameweek. Setup your team at GW1, hit a chip, and forget your team. What’s the maximum number of points a team can collect in this case?
This team reaches 2446 points (without including auto-sub points). It’s short of 111 points to win FPL, but this result puts you at 386 in overall rank 5.
This model is quite small in size, and was solved in just 2 seconds. The solver returned the following optimal squad and uses Bench Boost chip in GW1:
| Name | Lineup Count | Points |
|---|---|---|
| Pope | 38 | 170 |
| Alexander-Arnold | 38 | 210 |
| Doherty | 38 | 167 |
| van Dijk | 38 | 178 |
| Mané | 38 | 219 |
| Martial | 38 | 200 |
| De Bruyne (C) | 38 | 502 |
| Willian | 38 | 168 |
| Vardy | 38 | 210 |
| Ings | 38 | 198 |
| Jiménez | 38 | 187 |
| Ryan | 1 | 9 |
| Pieters | 1 | 14 |
| Dunk | 1 | 11 |
| Dendoncker | 1 | 3 |
| Total | 2446 |
So, the final answer to my poll was… B! This answer was the least popular choice. I would be curious to find out how the auto-sub & vice-captain points would change the result, though.
Again, the solution is available on GitHub in CSV format if you want to have a look.
35 points is the lowest points we get at GW5 and GW28. 108 is the best we have on GW31.
KDB returns a whopping 502 points in total.
Notice that KDB returns 502 while sum of our defenders returns 560 points, due to KDB’s constant captaincy.
Summary
Here’s a summary of all the models we considered.
| Model No | Points | Overall Rank | Note | Gap | Runtime |
|---|---|---|---|---|---|
| 1 | 4984 | 1st | Regular model | 1.09% | 4 days |
| 2 | 3945 | 1st | No hits | 15.39% | 18 hours |
| 3 | 3236 | 1st | No transfers | 0% | 6 minutes |
| 4 | 2446 | 386th5 | Ghost ship | 0% | 2 seconds |
As a reminder, Joshua Bull won 2019-2020 season with 2557 points.
Poll
Congrats to Neil for answering all three questions correctly. 🥳
I originally thought the answer to the last question was 400, but it is without auto-subs & VC. When you include them, 1 (A) becomes possible. So, congrats @_NeilFPL for answering all questions correctly :)
— Sertalp B. Çay (@sertalpbilal) May 12, 2021
4980, 3200, 1 (or 400🙃) https://t.co/54vBo5px9n
Insight?
Not really… but also, yes, sort of :)
FPL is a chaotic game and we know that variance play a huge role. Even if you could come up with a strategy from these results, there is no guarantee that you would do well the following season.
Hindsight optimization is cool and nice as an exercise, but real value lies in making better predictions and trying to optimize expected points. Optimization is a tool for prescriptive analytics, so it is better to utilize it for making better decisions through data and analytics. Nevertheless, this one was a very cool example to demonstrate the power of optimization.
Watch Joshua’s seminar talk on FPL titled Can maths tell us how to win at Fantasy Football? if you haven’t yet. Spoiler alert, the answer is “Not really… but also, yes, sort of.” ↩︎
Kristiansen, Bjørn Kåre, Akash Gupta, and William Eilertsen. Developing a Forecast-Based Optimization Model for Fantasy Premier League. MS thesis. NTNU, 2018. ↩︎
A great repository for all sort of data regarding FPL on GitHub ↩︎
FPL Research kindly provided points-ranks data from last year. Note that the final rank should be better when auto-sub included, but the auto-sub logic is non-linear, hence we left it out of calculations. ↩︎ ↩︎
