By Sertalp B. Cay | January 4, 2022
In this post, I tried to summarize the basics about using analytical tools and methods for Fantasy Premier League (FPL). There is certainly more out there than I can cover, but I hope this will help newcomers to understand what analytics is and how it can help you enjoy FPL more. Similar ideas can be applied to other fantasy sports games as well.
Part 1: Seeing Beyond the Curtain (Underlying Stats)
You are sitting on your couch on a Saturday morning and suddenly remember that you have to transfer someone for your FPL team to beat your friend in that mini-league. You open the FPL app, sort players by total points so far and transfer the player on top that you do not own! You are not 100% sure how the points system works in FPL, but after all, past performance should be an indicator of future performance, right?
The second part is true with an extra caveat: past performance is a noisy1 indicator of future performance. You also know that performance depends on fixture difficulty: sometimes teams have tough away games and sometimes they have very easy home games. Moreover, you might know that sometimes a player does nothing useful on pitch but magically gets a penalty, hence get awarded with an assist. So, not all performances are equal. In a way you know that the assist number you see might be a bit misleading.
Let us start with a simple exercise. You want to know how many goals Bernardo Silva will score in the next fixture. For this, you pull up Silva’s previous games and see what he has scored.
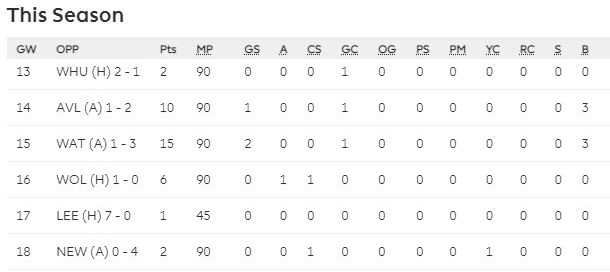
In these past 6 games between GW13 and GW18, he scored 0-1-2-0-0-0: 3 goals in 6 fixtures. But perhaps you heard from someone that his ‘underlyings’ are not that good. What they mean is an average player with the same offensive actions as Silva would likely have fewer than 3 goals. You might think “Well, but he is not an average player!”. This might be true, but players who can consistently beat their underlying goal expectations are rare.
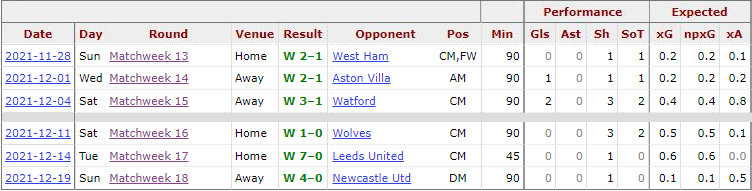
In the first 3 games Bernardo got 0-1-2 goals, but his ‘xG’ (expected goals - the proportion of times a shot with similar circumstances tends to result in a goal) shows 0.2, 0.2, and 0.4. In total, his xG is 0.8. Even though Silva might have exceeded his underlying with 3 goals, we would normally expect a player to get (slightly less than) 1 goal over those three games. So, even though he got 3 goals in 3 games, it does not look like a sustainable trend.
Then Bernardo Silva got 0-0-0 goals, with xG of 0.5, 0.6, and 0.1. He continued to get in dangerous positions (and actually got in more dangerous positions), but did not score any goals this time.
Studies have demonstrated that xG is currently the most predictive stat we have for future goals. A similar idea applies to assists and xA (expected assists). Intuitively if a player keeps getting off shots in dangerous positions or making great passes they will score or assist sooner or later. Note that having more data points about a player would give you a more reliable assessment.
So, we often check npxG (non-penalty expected goals, since penalties skew numbers) and xA of players instead of their goal, shot, shot on target, and assist counts. Welcome to FPL Analytics, you now know why underlying stats matter and how to compare two players better than an average FPL manager. That win in your mini league is coming.
Well, hopefully…
Part 2: Measuring the Fixture Difficulty (Team Strengths)
One of the most well-known metrics when it comes to evaluating fixtures in FPL are the Fixture Difficulty Ratings (FDR). FPL provides this value inside the game, and I believe it is one of the most influential decision making tools for many players.
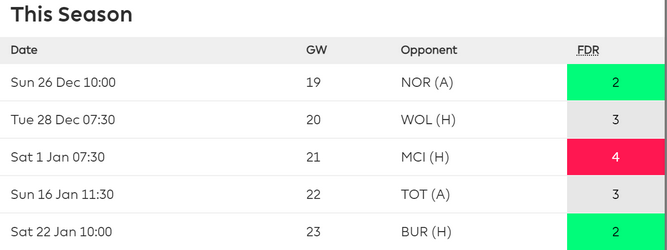
Perhaps FDR is a good starting point to understand how fixtures work, but it is certainly not sufficient by any means. For example, it does not really tell us why both Wolves and Tottenham have a difficulty rating of 3. Is it good to have an Arsenal defender for these fixtures, or is it better to have an Arsenal attacker? How much of a difference is there between a fixture with an FDR rating of 2 and another one with a rating of 3?
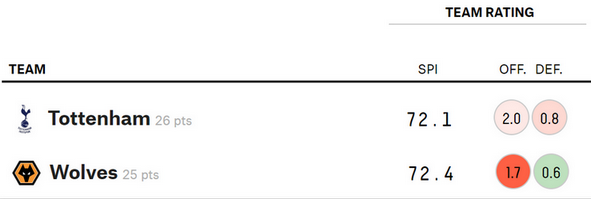
If you check FiveThirtyEight’s Premier League Predictions page, you can see the difference between these two teams. Tottenham have an offensive strength of 2.0, while Wolves have an offensive strength of 1.7. This means that we can expect Tottenham to score 2 goals against the average opponent, while we can expect Wolves to score 1.7. On the other hand, Wolves have a better defensive rating than Tottenham. As far as Arsenal’s fixtures are concerned, it sounds better to have a defender for GW20, and an attacker for GW22, than the other way around.
But as you see, this is still an oversimplified example.
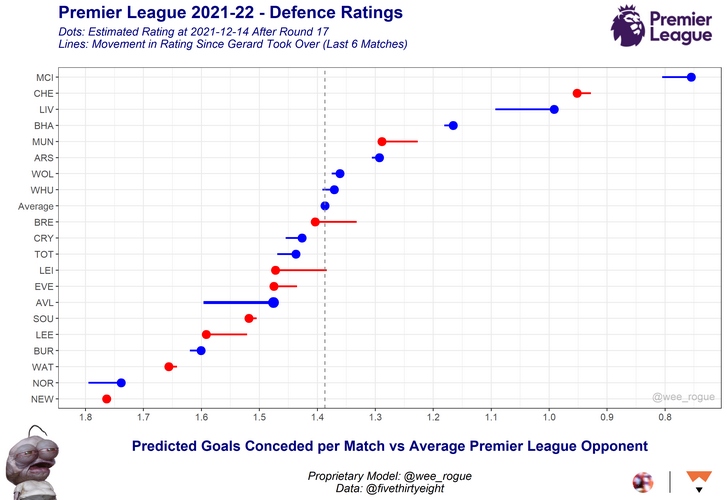
On Twitter, Wee Rogue uses a similar approach and generates “Predicted Goals Conceded/Scored Per Match vs Average Premier League Opponent”, instead of the average opponent from any league. This model works better for FPL purposes in order to differentiate good and bad fixtures than using a rating between 1 and 5, or even 538’s raw offensive/defensive strength.
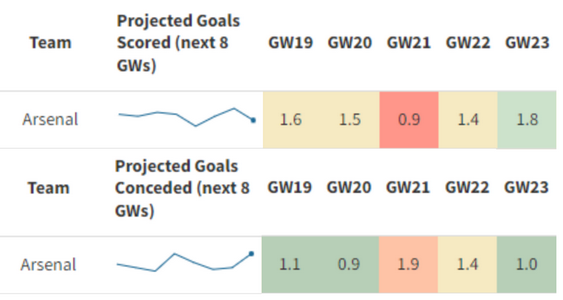
A great resource on this topic is Elevenify. The page shows you the predicted average number of goals in a table. Here, you can see that Arsenal are predicted to score 1.5 in GW20, 1.4 in GW22, and concede 0.9 and 1.4, respectively. Now we are in a much better position to compare what fixture difficulties should actually look like.
Part 3: Rolling the Dice (Expected Value)
When making decisions in FPL (indeed, in any game!) we want to take into account both the value and the probability of the outcomes our decisions could have. Any decision has a range of possible outcomes. Each individual outcome (say, keeping a CS, not keeping a CS, conceding two goals, etc) has two properties we are interested in: a particular probability of happening and a particular value if it does happen (most importantly to us, how many FPL points do we get!) We need a way to combine the value and probability of outcomes to assess which decision we ought to make. Enter Expected Value (EV), the lynchpin concept of game theory. Put succinctly, the EV of a decision is the probability-weighted average of the value of its outcomes.
In so-called deterministic choice-situations, there is only one possible outcome. This means effectively that the probability of the outcome = 100%, given the decision. In such situations, it is easy to choose. However, any given decision in FPL has a vast range of possible outcomes. Therefore, it requires multiplying the value of the pot with the probability of receiving it. Your defender could keep a CS (+4 pts), concede one goal (0 pts), concede two goals (-1 pt), etc. The outcomes have different point values, and they also have different probabilities of occurring. Let us look at this in some more detail.
We have already considered how to estimate predicted goals conceded. We know that a lower predicted goals conceded (0.9 vs 1.4) is better. But how much better is it? We need to know the probability of each individual outcome to calculate an EV. By assuming that the probabilities of each outcomes are distributed in a certain pattern, we may assign different probabilities to them occurring based off our predicted goals conceded estimate. We have chosen to assume a distribution (Poisson), which is a common distribution for rare events, like goals in football.
We can use this distribution to generate the probabilities of conceding (or scoring) 0 goals, 1 goal, 2 goals, etc. in a game.
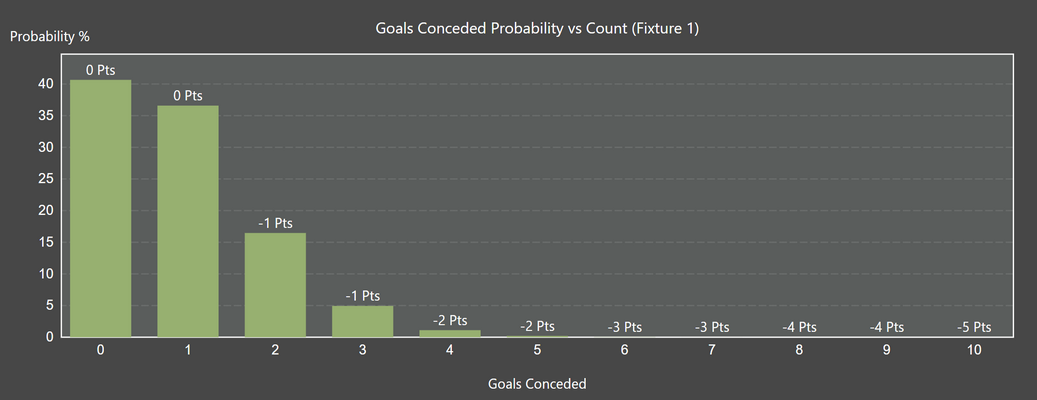
Using the Poisson model the probability of Arsenal finishing the game against Wolves with a clean sheet is around 40%, conceding 1 goal is 36%, 2 goals is 16%, etc. Since defenders get -1 point for every 2 goals conceded, we can actually simulate this fixture many times and see how many goals Arsenal concede in it on average.
- With 40% probability, a defender gets a CS, hence 6 points
- With 36% probability, a defender gets 2 points
- With 16% (2 goals) + 5% (3 goals) = 21% probability, a defender gets 1 point
- With 1% (4 goals) + 0.2% (5 goals) = 1.2% probability, a defenders gets 0 points…
By summing up these values we can compare both fixtures and calculate what it means for our FPL decision making.
- For the first fixture (Wolves), having an Arsenal defender brings you $$6 \times 40\% + 2 \times 36\% + 1 \times 21\% + \dots = 3.38$$ points on average.
- For the second fixture (Spurs), having an Arsenal defender brings you $$6 \times 25\% + 2 \times 34\% + 1 \times 35\% + \dots = 2.52$$ points on average.
You can use the EV Calculator and see how the values compare to each other (note that it excludes appearance and some other points).
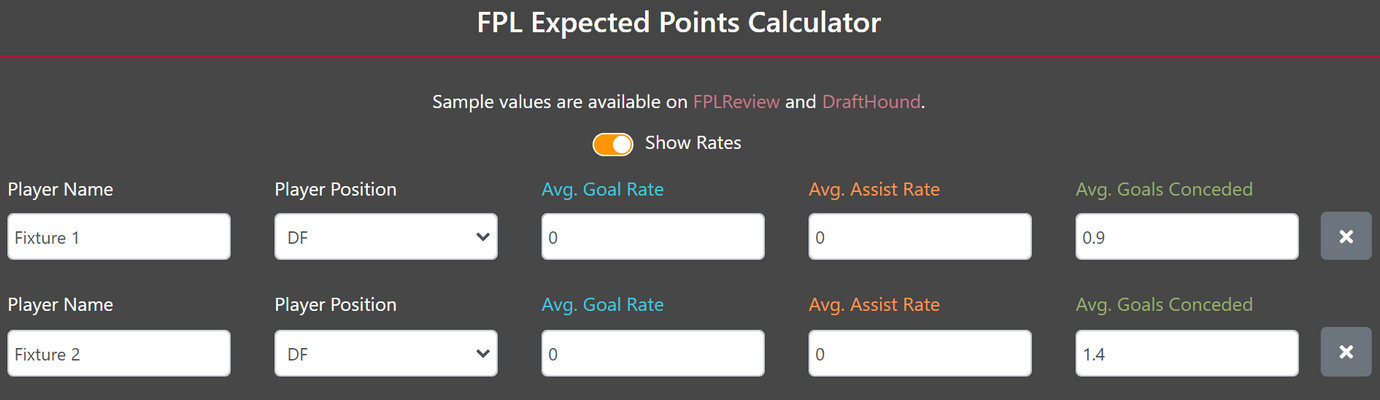
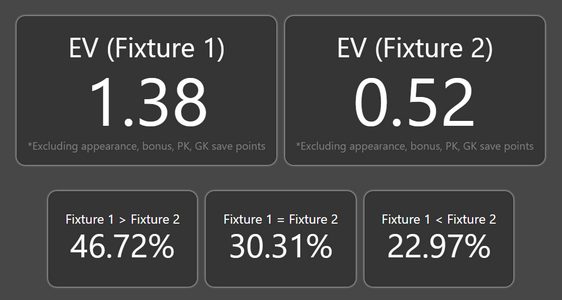
The EV Calculator can also show you the probability of having a better score in Fixture 1 than Fixture 2 (here, it is 46.7%). This way, you can get a much better sense of the amount of the risk you are incurring when you decide to go against the odds.
Although more complicated, similar processes can be used to predict goals and assists in a given fixture. These probabilities (anytime goalscoring, assist, clean sheet) can also be found online, and regularly shared on Twitter (@FPL_Salah).
Part 4: Predicting the Future (Predictive Analytics)
As we keep adding more and more details to our EV model (goals, assists, bonus, saves, penalties) and are also trying to predict the starting line-ups of teams, things get more complicated. Now, we do not only have the uncertainty over the rare events like goals, but also over some unique aspects of FPL like the bonus points system. On top of all these, some teams have notoriously difficult to predict starting line-ups and rotations (like Manchester City –aka Pep Roulette– and Chelsea –Tuchel Shuffle–)
It is possible to add more details to our model by coming up with a probability of a certain player (e.g. Foden) to appear in the next game. If we know that there is a 70% chance that Foden will play all 90 minutes, 20% chance of playing as a late substitute and getting 30 minutes, and 9% chance of starting but getting substituted off, once again, we can calculate the EV using the potential outcomes and these probabilities. Then, we can find his projected points per 90 minutes and calculate his expected points per game accordingly.
For the EV calculation, you can also add more details to improve the prediction power of the model. Things like number of touches in the box, crosses, and key passes can all be added to your model. Collecting the raw data and maintaining all these details might be a huge undertaking.
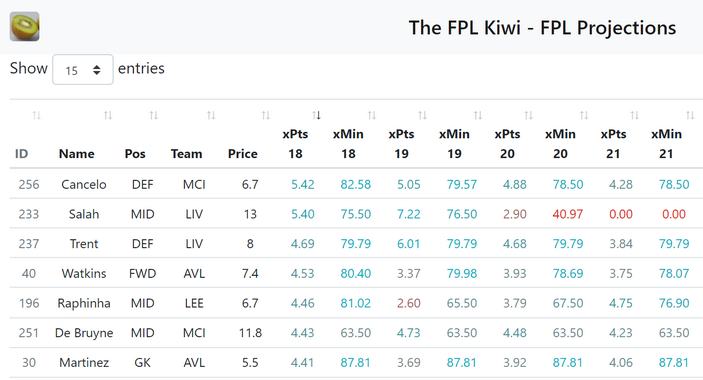
There are already people dealing with these aspects of FPL and sharing their models with the community. They follow the same steps outlined above: read past event data, create a prediction model, predict future probabilities and calculate EV for every player. Predictive analytics for FPL is having a boom, and you can find lots of people sharing their model outputs. Some of these models are free, while some others require a paid subscription. Some well-known ones within the community are FPLReview, Mikkel Tokvam, and the FPL Kiwi, but there are many more. We keep an updated list of prediction models in our Analytics Discord server for those interested.
Using a predictive model simplifies things for decision making. If you are interested in building your own model, give a listen to the Bonus Episode of the Corridor of Uncertainty podcast. Also consider joining our Discord server if you want to share your prediction model, or have any questions.
Part 5: Finding a Path inside the Chaos (Simulation and Optimization)
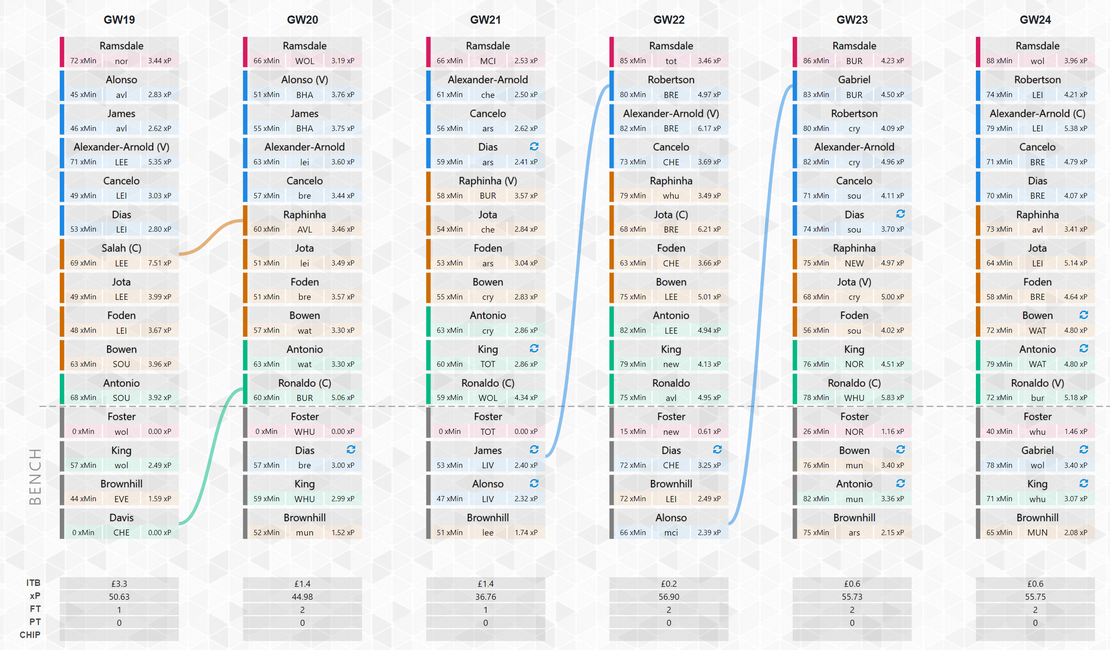
When you have the prediction data available, the last remaining step of the analytics process is dealing with the prescriptive analytics. You can use the projected points data and find a transfer plan that will maximize your total expected points (xP).
For this purpose, there are several versions of optimization available. The first one is called Mixed-Integer Linear Programming (MILP) where each decision (which player to buy/sell/bench etc.) is modelled as separate binary (yes/no) variables. Optimization solvers, then, can find the combination that will maximize total EV. MILP model solutions are proven optimals, as there cannot be any other combination of decisions where a higher EV is possible. If you are interested in how such models are written in Excel and Python, I have step-by-step tutorials available.
Since certain aspects of FPL actually cannot be written linearly (such as automatic substitutions), there have been other attempts to solve the problem. Heuristics methods available on websites like FPLReview and FantasyFootballFix are simplified methods that can try a limited number of moves and suggest the best known solution. As MILP models are limited by linearity, these tools are limited by time and memory restrictions, and cannot guarantee optimality. However, they can be used as a great starting point for your decision making.
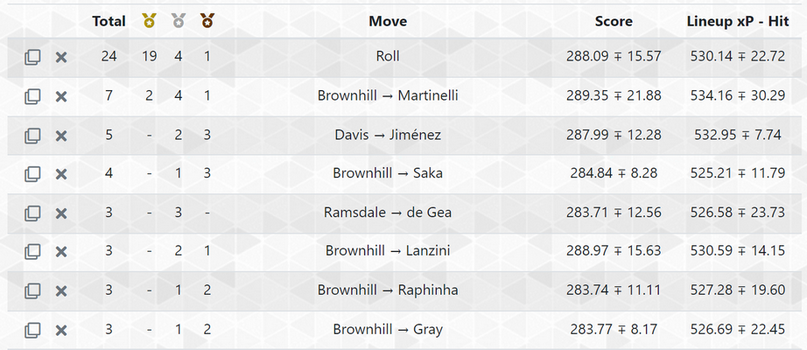
A major problem with optimization is the sensitive nature of it given prediction data. When data changes slightly, the optimal transfer might change significantly. To tackle this problem, @FF_Trout and I checked last year’s changes on FPLReview’s predictions and implemented an approach. Instead of solving the problem once and being done with it, we solve the problem repeatedly to optimality (MILP model) and report how often a transfer is the optimal move. If you repeat it long enough, you will be able to see all the available paths.
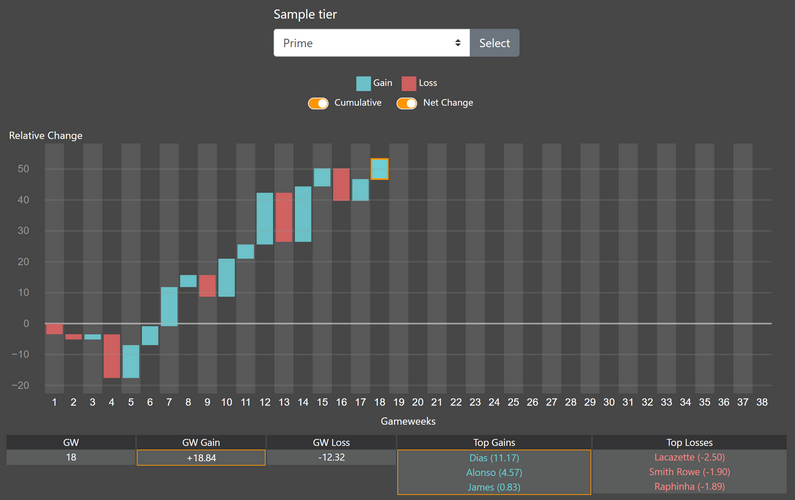
Simulation Optimization is also another method that I find very promising. We have started taking the first steps for this effort with the generated simulations on FPLOptimized. It helps us to understand the field better, and to exploit the suboptimal play of other managers in mini-leagues or in top Overall Rank tiers. Simulations are particularly useful to understand the effect of EO, and how it can shape our optimal policy.
Part 6: State of the Art and Future (Forefront of Augmented Intelligence)
One topic I often find myself discussing with others is how useful all these methods are. Some people claim it can never beat the top managers while some others are suspicious of the quality.
I understand the concerns, but these methods are not here to make you play like a robot. There are lots of places FPL managers can outperform models. For example you might be able to predict Manchester City lineups, putting you one step ahead in your path to picking a good team. All these analytics methods are here to simplify your decision making process. That is the main reason why we call these methods “Decision Support Systems”. Augmented Intelligence is the effective use of data and analytics to augment human intelligence. Instead of making FPL boring for you, these tools can help you narrow down sensible transfer options to a reasonable number.
I strongly believe that an automated analytics tool as advanced as we currently have can easily beat the field average. An obsessed FPL manager who tracks every piece of news and spends a lot of time on FPL can beat a fully automated FPL bot. However, a sufficiently good manager with these analytics approaches will end up on top in the long run more often.2 That is partially why analytics is already huge in other fantasy sports where rewards are more significant. FPL is a great reason to get yourself familiarized with how to read data and to start learning about analytical tools.
Even if you are a veteran data scientist trying FPL for the first time, or someone who played FPL many years but never tried analytical approaches, consider joining our FPL Analytics Discord Server where we talk everything that there is to talk about considering analytics in FPL.
Part 7: FPL Analytics in a Nutshell
Too Long; Didn’t Read? Or worried that you will forget what has been discussed?
Here is a summary.
- Do not use goals and assists to predict future goals, assists and clean sheets. Use npxG and xA from fbref.com.
- Do not use FDR difficulty of the FPL app. Use 538 team club strengths or similar works on the web for these values.
- Fixtures on FPLOptimized
- Elevenify
- Wee Rogue’s PL model
- Remember that point outcomes are probabilistic, and follow a simple (but noisy) distribution. Something as simple as betting odds is a better indicator of future GW returns.
- If you want to check expected returns for more than 1 GW, either develop your own model, or use a prediction (premium or free) model.
- We have a list of available prediction models on our Discord server.
- There are millions of paths to choose from. Use optimization to find out the “Expected Value Optimal” strategy to minimize the transfers that you need to evaluate.
- Excel and Python tutorials to learn how optimization models are developed.
- FPLNathan`s FPL Solver if you want something easier to use right away.
- I also regularly write and share tips about optimization models on Twitter!
- Know that there are multiple analytics tools and their number is increasing as days go by. Get familiar with what is available.
- Want to learn more or have further questions? We have a friendly Discord server for people to hang out, discuss, and ask questions.
- Link to FPL Analytics Discord server (temporarily disabled)
- Link to Analytics xP League mini-league
Glossary
- EV: Expected Value. It is a term to measure the average value obtained out of possible outcomes using their associated probabilities.
- EO: Effective Ownership. It signifies the percentage of effective owners summed with captaincy multipliers. E.g. Ignoring chips, if Salah is owned by 90% of players, benched by 1%, and chosen as captain by 70%, then his EO is
90% - 1% + 70% = 159%. This affects how much the FPL average changes when he returns points. Note that FPL managers using the Triple Captain chip on a player and the Bench Boost chip while benching a specific player also increase a player’s EO. - GTO: Game Theory Optimal. A common term for the optimal strategy in games. FPL’s GTO is a bit more complicated, but we know that maximizing EV is either GTO or a very close suboptimal strategy.
- xG: Expected Goals. It is a metric used to figure out how likely a shot is to end up as a goal based on various attributes (shot location, body part used, opposing goalkeeper’s position, etc.).
- xP: Expected (projected) Points. xP represents future point averages, based on a predictive model. It is essentially EV for projection models.
Credits
Each part of this blog post is a collaborative work with the following awesome people.
- Part 1: @FPLSimpson and @dilksybab
- Part 2: @wee_rogue
- Part 3: @FPLSigurd
- Part 4: @theFPLkiwi 🥝
- Part 5: @FF_Trout
- Part 6: Allan Dann Under
Noisy means there is a lot of uncertainty involved. ↩︎
Chess is a great example where intelligence augmententation makes a big difference. See this article for more: https://qz.com/921099/the-future-of-ai-isnt-hal-its-intelligence-augmentation/ ↩︎
