By Sertalp B. Cay | January 12, 2021
“The Numbers Game”1 is a great read for anyone interested in football (soccer) analytics. The book covers a wide range of events where numbers give insights to football professionals on topics like possession, short/long passes, and team evaluation. I have recently read the section about the “O-Ring theory”, which brought a couple of new ideas regarding FPL.
O-Ring theory says that a team (or a system) is as strong as its weakest link. The idea itself is coming from the Space Shuttle Challenger, where the failure of O-ring seals caused the catastrophic event in 1986. When applied to football, the theory points out that clubs should be improving (or replacing) their weakest players in the field, instead of focusing on superstars.
I have been talking about applying optimization to FPL for a while now, but this theory brings a whole new aspect to it. I accept that the O-Ring theory does not make a lot of sense when thinking about FPL initially. After all, our teams are not actually playing together. However, we all have £100M (more or less) that we have to spend on a 15-players squad and our distribution of the budget determines our expected points. It is tempting for managers to go after that shiny and expensive premium midfield, but it may force you to end up with a few players who has low expected points. So, I will talk about how we can use optimization to have an FPL team where the weakest link is optimized.
O-Ring Model
Before we go into details of the O-Ring model, let me point out the paper “Testing the O-Ring theory using data from the English Premier League”2 by Syzmanski and Wilkinson. The paper concludes that the superstar theory is more effective than the O-Ring theory based on their study on EPL. This might be the case for FPL as well, but the following models can still give you new ideas to improve your own models.
Quick note, mathematical details regarding following models are placed at the bottom of the post.
In a typical FPL optimization model, our aim is to maximize the expected points (xP). You are simply choosing 11 players out of over 600 players that will maximize your total xP. If you maximize GW16 expected values (using FPL Review MD data), you will get the following optimal team (under £100M budget). This is our base model.
Pope, Robertson, Alexander-Arnold, Maguire, Alderweireld, Dier, Salah, Fernandes, Bamford, Adams, Kane 3
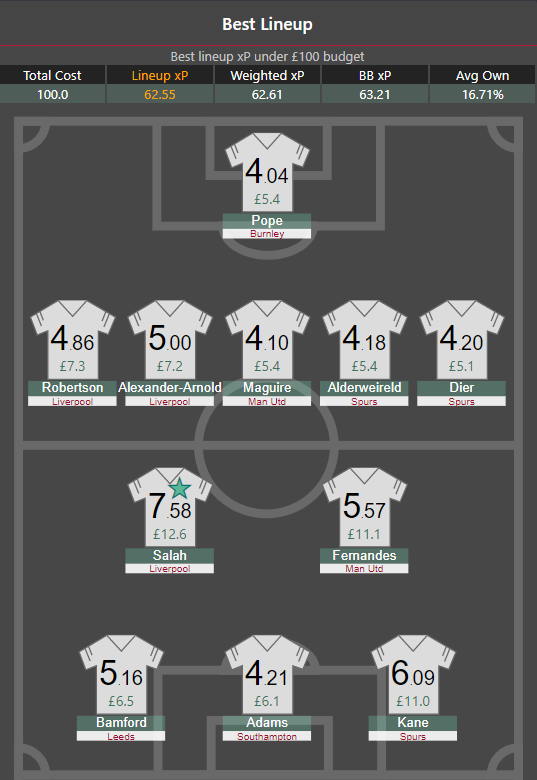
The total xP of this lineup is 54.970 (excluding captaincy). As strange as it looks, this is indeed the optimal solution that maximizes the total xP. However, it is curious how unbalanced and unorthodox the team looks with its 5-2-3 formation. But it is valid!
The main logic of the O-Ring model is to assess a team with is worst player. In this case, the worst player we have on the field is Pope – 4.04 xP.
In order to improve this lineup, suppose that you have decided to iterate over all the goalkeepers and found Lloris with 4.21 xP. For the replacement, you need to check if you have enough budget. Since GK is no longer the weakest link, you can focus the next one: Maguire with 4.10 xP. You can iterate defenders, or maybe drop Maguire and get a midfield or perhaps a forward from the bench. It should be obvious that the problem quickly spirals out of control. There are simply too many possibilities to iterate. This is where optimization comes into play and saves the day.
There is a definite answer to the question of “How much can we increase our worst player?”. Or “What is the optimal lineup that will maximize the minimum xP I have on the field?”. To answer this, we can write a “maximin optimization” model. (See details at the end)
Solving the problem will yield us the following lineup with xP of 52.17:
Lloris
Robertson, Alexander-Arnold, Dier
Pulisic, Fernandes, Ward-Prowse, Son
Bamford, Firmino, Adams
Since we maximized the minimum xP on field, note that this model does not care about the total xP at all. Minimum xP among all this 11 players is 4.19. As our next step, we can use this value as a constraint in our base model (maximize lineup xP), forcing all players to have at least this much xP. This method is called “epsilon-constraint”, where the optimal solution of a model is fed into the second model with a different objective.4
By enforcing the minimum (O-Ring player) to have at least 4.19 xP and maximizing the lineup xP, we get the following solution:
Lloris
Robertson, Alexander-Arnold, Dier
Pulisic, Salah, Ward-Prowse, Son
Werner, Bamford, Adams
Fernandes and Firmino out, Salah and Werner in. Total xP is 53.448, and formation is 3-4-3. Not bad! Our weakest link in the new lineup is Ward-Prowse – 4.19 xP. See how the distribution of xPs change in the new lineup.
Compared to the base model, apparently the budget we gained from dropping Kane and Fernandes is used to upgrade low xP players: Pope, Maguire, Alderweireld.
Positional O-Ring Model
As you may have noticed, our new lineup has a very strong midfield setup. Our total xP allocation for each position is as follows:
| Total xP | GK | DF | MD | FW |
|---|---|---|---|---|
| 53.448 | 4.218 | 14.059 | 21.390 | 13.781 |
Notice the total xP of MD and FW positions. The lineup still feels unbalanced, even though we improved the weakest link. This one is not unbalanced because of the formation (3-4-3 is quite balanced) but in terms of where we are expecting our points from. We are expecting 21 points from midfields, while only 14 from forwards.
So what if we try to increase our FW expected points by dropping one of our premium midfields and upgrade one of our forwards. We have another O-Ring model, but this time we are maximizing the minimum among total xPs of each position (excluding GK). The objective is to “maximize the minimum among total positional xP values”. We need to use the 2-stage optimization again as I have mentioned:
- Maximize the minimum of position xP totals (DF, MD, FW)
- Maximize the lineup xP where total of each position is bounded below
The first stage model finds that you can increase positional sum all the way up to 16.395. After the second stage is completed, we have the following lineup:
Lloris,
Pieters, Alexander-Arnold, Maguire, Dier
Harrison, Salah, Fernandes
Bamford, Firmino, Kane
We have a 4-3-3 formation, with positional xP sums below.
| Total xP | GK | DF | MD | FW |
|---|---|---|---|---|
| 54.454 | 4.218 | 16.826 | 17.015 | 16.395 |
Notice that we are only 0.52 away from the overall optimal and have a very balanced squad now. It worth mentioning that FPL has too many suboptimal solutions, and having multiple objectives help us to break ties.
As you see, our Positional O-Ring model expected values are much closer to each other than the base and O-Ring models.
Value and Ownership
FPL Review defines value as the total xP divided by the player’s buy cost. So, I wondered what if we try to maximize the minimum value in our lineup.
After the 2-stage optimization process, we get the following lineup:
Lloris
Robertson, Alexander-Arnold, Maguire, Alderweireld, Dier
Harrison, Ward-Prowse, Raphinha
Bamford, Adams
This is quite an interesting team! In the base model, lowest value among the lineup is 0.502. The lowest value in the lineup above is 0.665! Total xP, on the other hand, drops massively from 54.970 to 47.722. Unfortunate.
There is another model with a weirder result.
Since I’m pretty obsessed with ownership lately, I have tried maximizing the minimum ownership in the lineup. This should force model to find the template. I should mention that the player with the minimum ownership ratio in the original optimal solution is Alderweireld with 1.7%.
| Name | xP | Ownership (%) |
|---|---|---|
| Pope | 4.035 | 10.1 |
| Robertson | 4.859 | 22.6 |
| Alexander-Arnold | 5.004 | 14.6 |
| Maguire | 4.099 | 3.4 |
| Alderweireld | 4.183 | 1.7 |
| Dier | 4.196 | 5.7 |
| Salah | 7.575 | 45.5 |
| Fernandes | 5.568 | 46.2 |
| Bamford | 5.155 | 46.9 |
| Adams | 4.209 | 9.5 |
| Kane | 6.087 | 42.1 |
The O-Ring model for ownership ratio gives the following lineup.
| Name | xP | Ownership (%) |
|---|---|---|
| McCarthy | 3.604 | 23.0 |
| Zouma | 3.495 | 27.1 |
| Chilwell | 3.405 | 24.2 |
| Justin | 3.152 | 25.8 |
| Robertson | 4.859 | 22.6 |
| Grealish | 3.467 | 41.8 |
| Fernandes | 5.568 | 46.2 |
| Son | 5.296 | 62.5 |
| Calvert-Lewin | 3.235 | 58.9 |
| Bamford | 5.155 | 46.9 |
| Kane | 6.087 | 42.1 |
Well, as you see, the minimum ownership ratio of the players jumped from 1.7% to 22.6%. You might be thinking that this lineup looks solid. But the total xP actually fell even more. It is 47.323.
Yes, this 11 is worse than the “poor man’s value team” with 47.722 total xP:
| Name | xP | Ownership (%) |
|---|---|---|
| Lloris | 4.218 | 7.2 |
| Robertson | 4.859 | 22.6 |
| Alexander-Arnold | 5.004 | 14.6 |
| Maguire | 4.099 | 3.4 |
| Alderweireld | 4.183 | 1.7 |
| Dier | 4.196 | 5.7 |
| Harrison | 3.872 | 2.3 |
| Ward-Prowse | 4.190 | 17.6 |
| Raphinha | 3.737 | 1.5 |
| Bamford | 5.155 | 46.9 |
| Adams | 4.209 | 9.5 |
Comparison and Conclusion
It is time to list all the models we have seen for comparison purposes.
| Problem | Total xP | Pos. Total xP | Min xP | Min Value | Min Own |
|---|---|---|---|---|---|
| Base | 54.970 | [4.035, 22.341, 13.143, 15.451] | 4.035 | 0.502 | 1.7 |
| O-Ring | 53.448 | [4.218, 14.059, 21.39, 13.781] | 4.190 | 0.475 | 2.5 |
| Positional O-Ring | 54.454 | [4.218, 16.826, 17.015, 16.395] | 3.527 | 0.502 | 0.3 |
| Value O-Ring | 47.722 | [4.218, 22.341, 11.799, 9.364] | 3.737 | 0.665 | 1.5 |
| Ownership O-Ring | 47.323 | [3.604, 14.911, 14.331, 14.477] | 3.152 | 0.404 | 22.6 |
There is no clear winner, so it is up to your personal taste. I think Positional O-Ring is pretty promising.
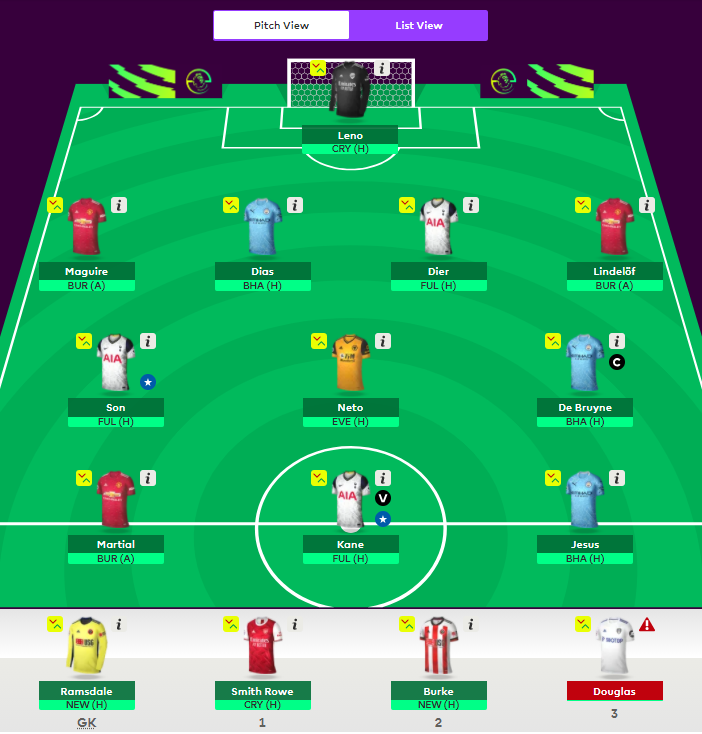
I have decided to put my FPL lineup where my mouth is. My regular FPL model is a multi-period variant of the base model, but I have used Positional O-Ring for GW18 inside a 3-step process for the FH chip. I switched from having an unbalanced 21/19/13 xP (5-3-2) to 17/17/18 (4-3-3) which decreased the overall xP by about 2 points. I’m curious to see if it will be a successful experiment.
I’m not sure how I’ll proceed for the rest of the season. Positional O-Ring produces a suboptimal solution where I have to lose a bit of an xP, but I can keep using it if the difference is small enough. These models will be especially useful when I use my WC somewhere down the line.
It was an interesting exercise. I could add some of these models (and their daily solutions) to FPL Optimized’s “Optimal Squads” page if anyone is interested. I am open to any feedback or suggestions.
Technical Details
Our base FPL Model maximizes the expected points, as follows:
$$ \text{maximize: } \sum_{e \in E} P_e \cdot x_e $$
Here, $P$ is the expected points of player $e$ in the following gameweek, and $x$ is the binary value (1 if we have the player in our lineup, 0 otherwise). This sum gives us the total xP of the lineup.
In order to apply the O-Ring idea, we need to use a “maximin optimization” model. Our target now is to maximize the minimum xP in our lineup. It looks like this:
$$ \text{maximize: } \min \left \{ P_e, e \in E : x_e=1 \right \} $$
With a well-known trick, we can introduce variable $w$, maximize its value, while forcing everyone in the team to have a higher value:
\begin{align} \text{maximize: } \; & w \\ \text{subject to: } \; & \dots \\ & w \leq P_e \cdot x_e + M \cdot (1-x_e) \quad \forall e \in E \end{align}
Here, we are using the “Big-M method” to force $w$ to be smaller than every player in our linuep.
Positional O-Ring model is quite similar and simpler. We don’t need the Big-M for this one:
\begin{align} \text{maximize: } \; & w \\ \text{subject to: } \; & \dots \\ & w \leq \sum_{e \in E[t]} P_e \cdot x_e \quad \forall t \in T \end{align}
Here, $T$ is the set of positions (DF, MD, FW), and $E[t]$ is the subset of all players for the specific position $t$.
See my source code and how I solve these problems using sasoptpy and CBC on GitHub.
Anderson, Christopher, and David Sally. The numbers game: Why everything you know about soccer is wrong. Penguin, 2013. (Amazon Link) ↩︎
Szymanski, Stefan, and Guy Wilkinson. “Testing the O-Ring theory using data from the English Premier League.” Research in Economics 70.3 (2016): 468-481. (Science Direct Link) ↩︎
Optimal lineups/squads at FPL Optimized are generated 4 times everyday. You can go back in time and check old optimals. ↩︎
I have mentioned multiobjective optimization in the previous post, as well. In that one we have used “weighted-sum method”. ↩︎
