By Sertalp B. Cay | July 9, 2021
Taking a serious interest in sports analytics was probably the best thing I did during the pandemic. Not only is it fun to play with and analyze, but it’s also easy to make connections with ongoing events while also providing you with a broader understanding of the sports. There are, however, a few roadblocks. Reaching to the data, especially on-pitch data, is very difficult. You can find summarized stats but more granular specifics such as tracking data is treated as a premium commodity and understandably so.
One thing I really wanted to take a shot at was building predictive models for sports. Despite me being a rather quantitative person I’ve never really attempted to build one out. I believe that the best way to learn something is build it up from scratch. While it takes a significant amount of time, it’s almost always worth it.
Initially, my desire was to build a predictive model for football (soccer) before I realized that there were similar avenues that offered additional advantages. I was looking for a ‘sandbox environment’ where I could access plenty of data and really learn my stuff. Then, two things happened:
- I met one of the top Fantasy Premier League managers1, Allan.
- I learned that there is a way to export data from the game Rocket League, which is a game I really enjoy.
If you are not familiar with Rocket League and are wondering why I am this excited, let me explain briefly.
Rocket League for Beginners
Rocket League is a multi-platform game where each player controls a car with a rocket booster attached to it. Each car is similar in terms of technical properties even though they have customizable cosmetics2. The purpose of the game is to score as many goals as possible within 5 minutes using a comically oversized ball. In the case of a tie between the teams, the game goes to “Overtime” where the golden goal rule applies (aka sudden death; first one to score wins the game).
So far, so good. Things are pretty straightforward which results in a game that’s easy to play but hard to master especially when players start dribbling the ball mid-air with their rocket boosters.

The game is a mix of ice hockey (as the ball never goes out of the field) and football (similar in movements). It is a team game with various sizes, but I will mainly talk about 2 versus 2 player mode below.
In terms of movements, you can control the direction, velocity, rotation (x/y/z) while also using the jump button to hit the ball harder. This allows you to take shots or control your car to a certain degree in order to dribble, pass, and block incoming shots. See the footage below of a goal I scored in a competitive game.
The Rabbit Hole
After the FPL season was over, I met Allan. He is a super fast programmer with a great grasp of technical concepts. Mosty importantly, he is an excellent Rocket League player which led to us playing some games together in starting in early June.
Around this point we realized that it was possible to extract data from Rocket League replays (think full recreatations of past games all inside the game engine). I knew that some people built analytical models in the past, hence I knew that there was a way to do it. Then we found Ball Chasing, a website where you can upload your past games and view in-depth statistics. Later on we realized that we could generate the same data using a Python package called carball.
In a matter of days, we built a great pipeline that:
- Uploads game replays to BallChasing automatically (BakkesMod).
- Downloads our games (BallChasing API).
- Converts replay files to JSON and CSV data (carball).
The amazing thing is that carball is able to give you data frame-by-frame at a rate of 25 frame per second. That is a lot of information. By using the on-target shot detection carball offers, we were able to extract all data pertaining to player locations, velocities, and rocket booster levels.
But… why?
By using Rocket League as our perfect sandbox, we can gain substantial experience with models with the readily available and clean data. From there, anything you can build with Rocket League data, you can replicate to varying degrees across real-time sports with messier data (e.g. basketball, hockey, soccer, football).
It makes it possible to:
- Analyze individual contribution.
- Summarize individual and team tendencies in terms of play style.
- Generate team reports for major issues.
- Evaluate individual positioning and contribution.
Most importantly, you can build an expected goal (xG) model to predict goals for a given frozen frame. Expected goal models provide a better evaluation of shot-taking quality in the long run. It is an unbiased estimator of goals a team is expected to score in the long run. If you’re coming from somewhere like the FPL community, you’ll see this commonly referenced.
All this provides quite a bit of exposure to cutting edge technologies that are being used in many sports.
Dashboard
To help us interpret information, we created a dashboard to display raw stats such as number of shots, goals, assists, saves etc. Allan’s experience with matplotlib helped a lot during this process.
We have a GitHub webpage that we regularly update with these stats in case you are curious how this is presented. You can also check our GitHub repository to see what is under the hood.
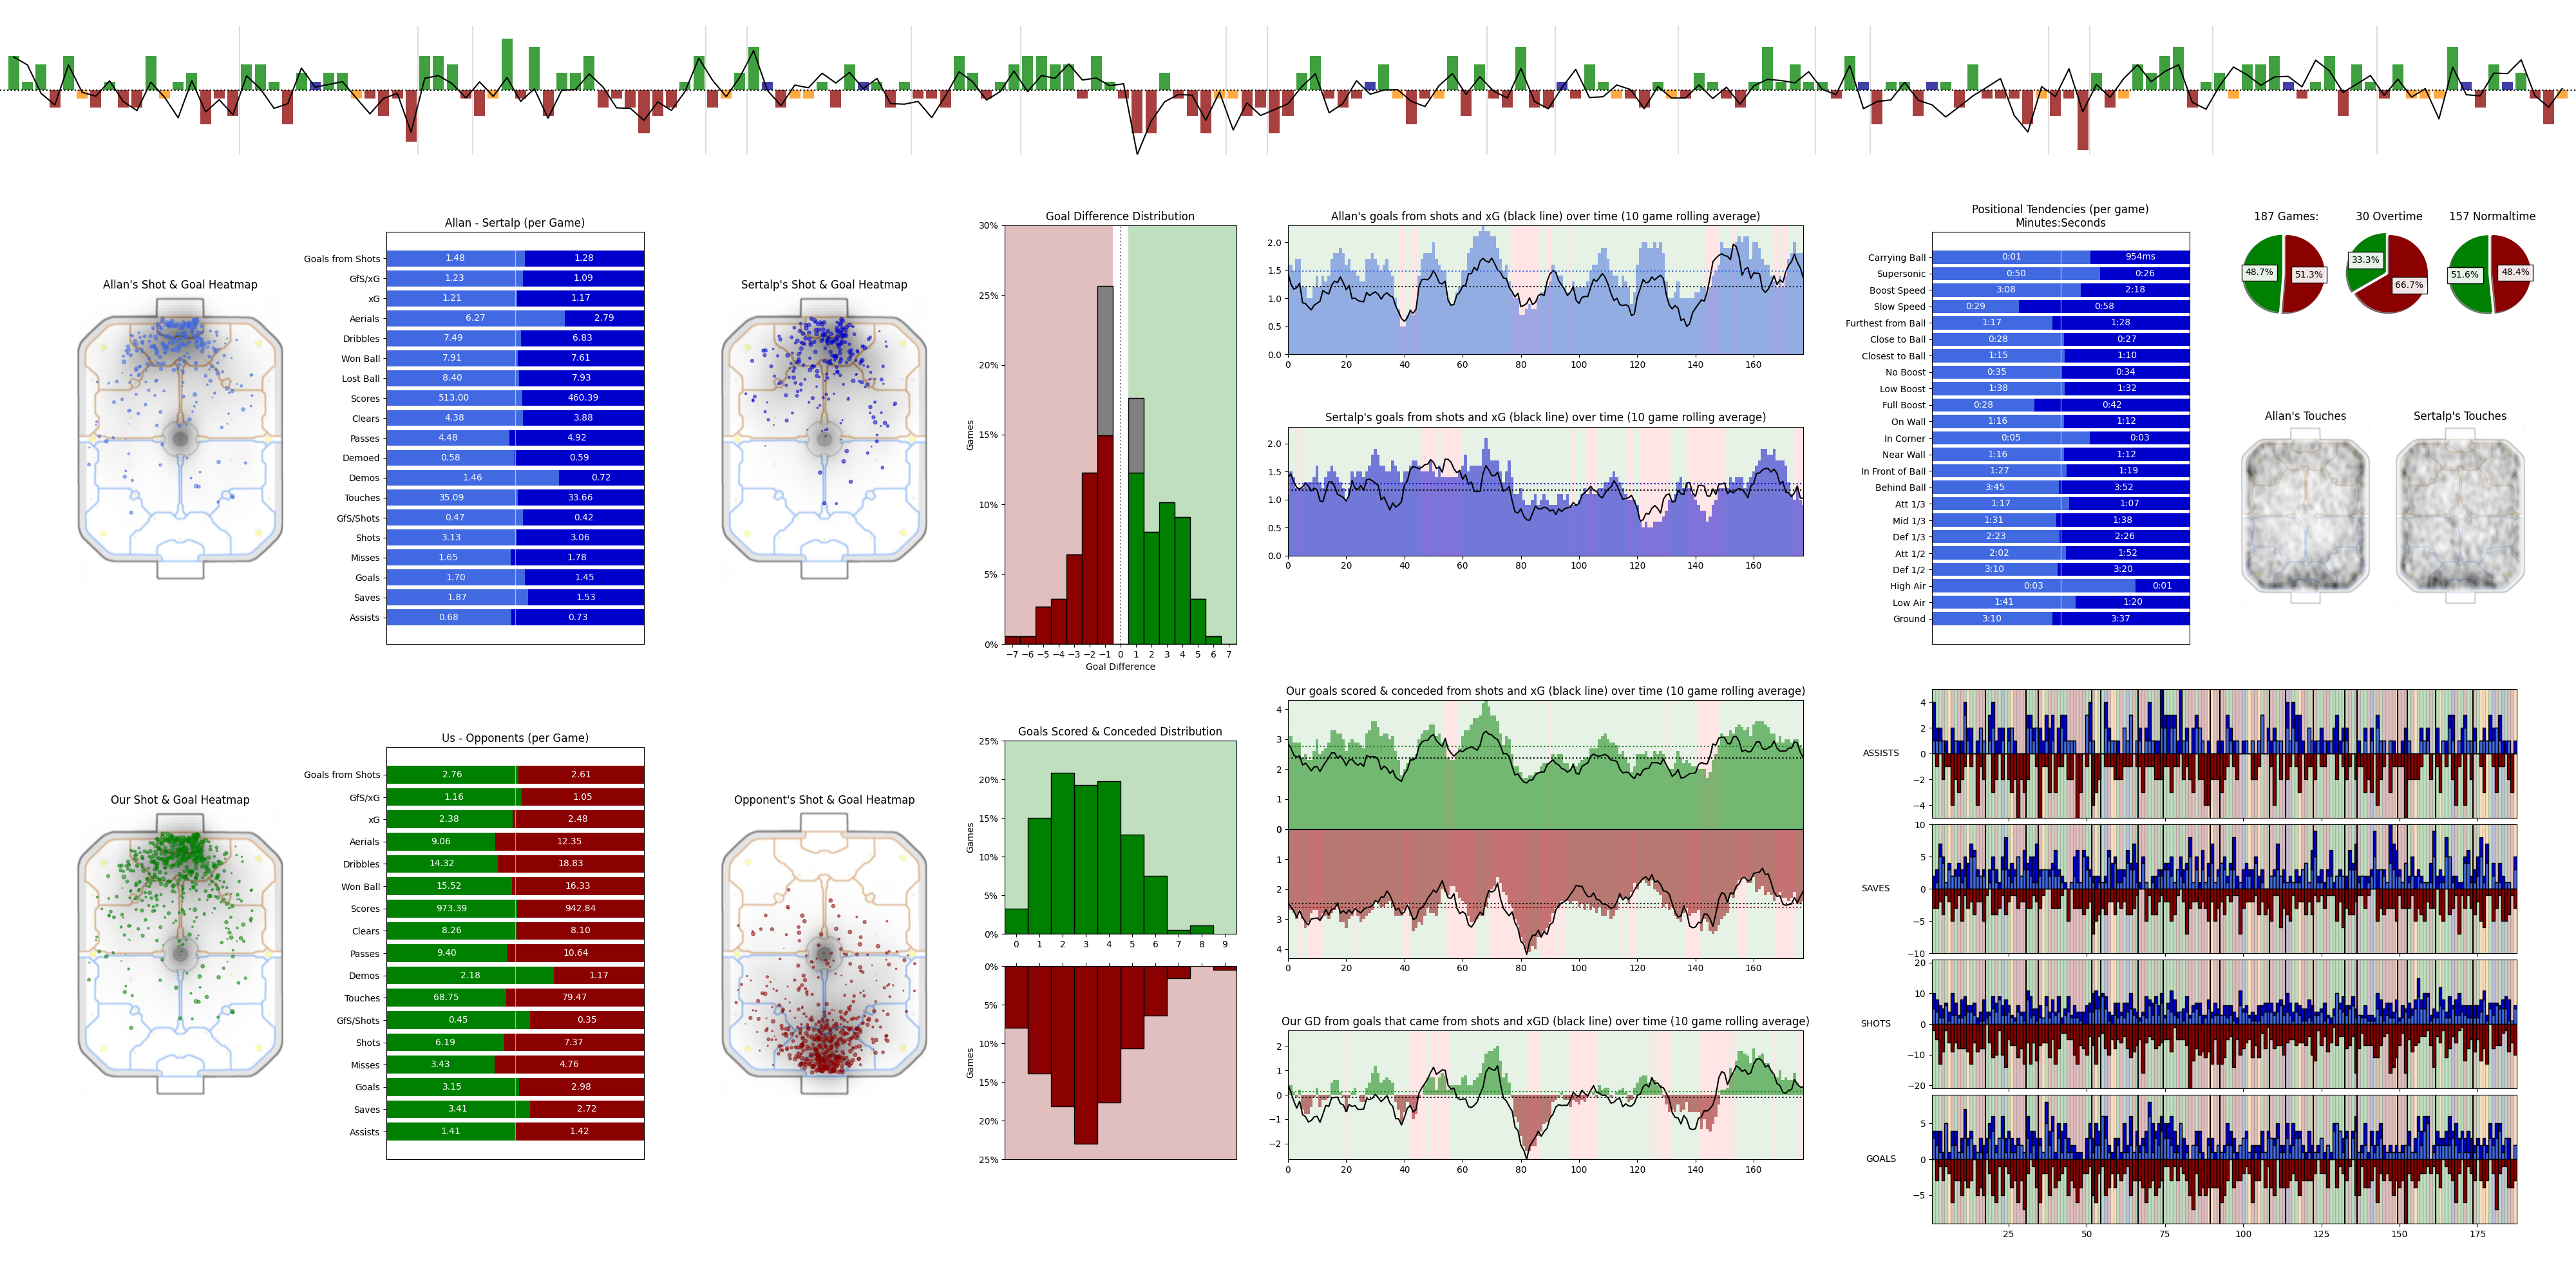
As you can see, the dashboard includes many components, from individual statistics to tracking heatmaps. Some of the features include:
- A bar chart which shows the goal difference (for minus against) for all games.
- Shot and goal scatter plots which show the position and xG rating of shots (radius).
- A goal difference bar chart which shows the distribution of outcomes (gray color indicates overtime games, green ones are wins, red ones are losses).
- The goals from shots bar and line chart which shows the number of goals scored by individuals and teams (bar) and xG level for a 10-game rolling horizon (solid line), while dashed lines show overall averages.
- Positional tendencies stacked bar charts which show comparisons of play style and positional summaries.
- Touch heatmaps which show where the player hits the ball on the pitch.
The dashboard might seem like a bit much to take in all at once, but each of these plots serves a specific purpose.
Expected Goals (xG) Machine Learning Model
Expected goals in football can be measured in various ways. Models use the position of the shot-taker, the body part used in the shot, and various indicators (e.g. if the shot was shot with the player’s dominant foot). More detailed models also benefit from defender and goalkeeper positions as this increases the model’s accuracy significantly but requires more data to be processed. All in all, the more information we add to the model, the more accurate we can be in predicting whether a shot will be a goal.
I had a very insightful talk with Jan Van Haaren on xG models. Jan mentioned that if we add all the details into the model, then it no longer predicts anything, but rather you know the exact outcome. A particular case of determinism; when you know everything there is to know, then you know the outcome. In our case, such a model doesn’t really provide any insights. For that we’ll have to leave out some details on purpose and select key features in order to measure how good a shot is.
For our Rocket League data, the case is very similar. We have access to so much data that we can precisely calculate the ball’s trajectory and know if it will be a goal or not. By using only location data (including position, velocity, angular velocity, and rotation) of the shot-taker and the defenders, we can come up with a solid model. And that is essentially what we did. We collected 4328 games3 from the BallChasing website. These games gave us 657,897 hits in total4 and we trained the model using XGBoost5.
The final ROC-AUC score is 0.6342, PR-AUC score is 0.212, and the accuracy of the classifier on the test set is 96.87%. The accuracy is skewed by the disproportionate amount of non-goal hits.
I have also tried oversampling goals to make it more even at one point, but we have observed more consistent total xG values by keeping the data as is.
After the xG model was developed, we prepared interactive tools to see game details. You can hover/touch a few positions below.
| Player | xG | Goal | Replay |
|---|
The size of the circles and stars indicate the xG value of the chance; the bigger the shape, the better the chance of a goal. Usually you get a low xG when defenders (blue) are between the ball and the goal, or the hit takes place far from the goal. As you see, this xG model is useful for understanding if we scored/conceded a goal by mostly luck, poor goalkeeping, or if the shot was really effective.
Since we knew the xG value of each hit in the game, the next step was to build an xG race / step function plot to see who has the game under control.
You can find this game’s details here on the website we created on GitHub Pages.
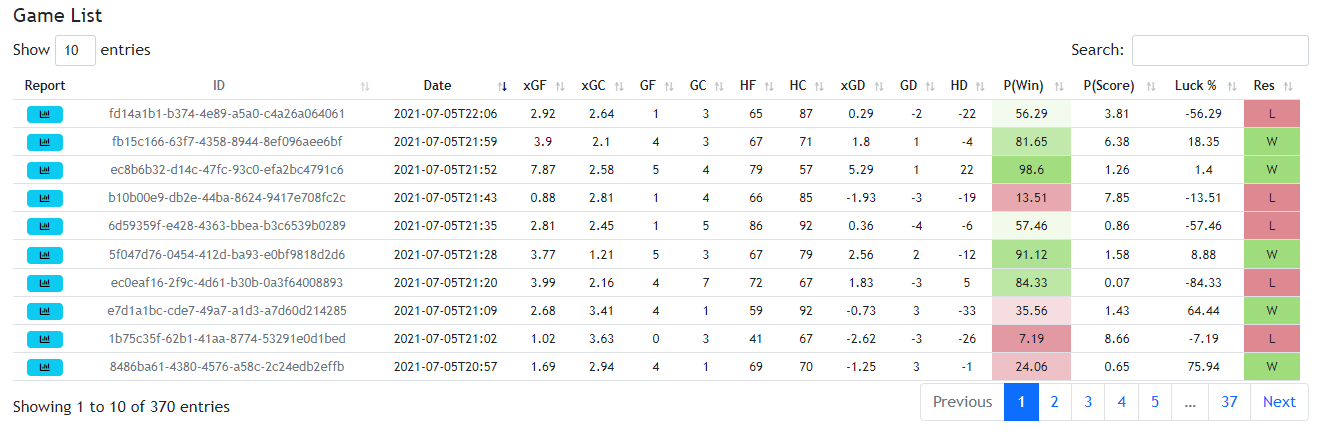
Win and Score Probabilities
There were many other outcomes that could be calculated stemming from the xG model. One of them was calculating the probability of winning the game6 while another was calculating the probability of the final score being what it was based on xG values.
xG Over Horizon
Checking xG values for individual games is known to be a rather poor practice. It is better to check how the cumulative xG behaves over a rolling horizon, hence the reason we use a rolling average of 10 games in the dashboard.
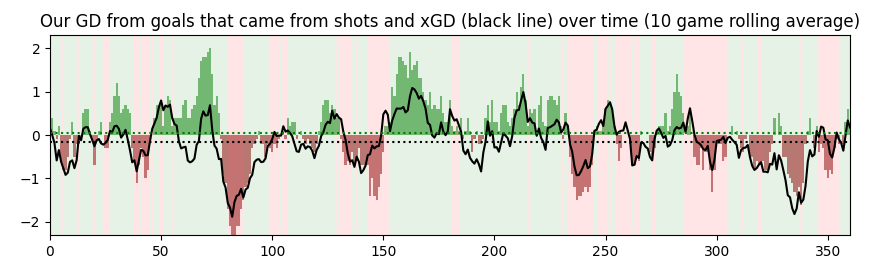
This plot shows the goal difference (GD) for a 10-game rolling average. The black line shows our xGD level, while green and red areas indicate the goal difference (our team minus opponent). It’s great to see that our actual values align with expected values.
What’s Next?
The xG model can certainly be improved by experimenting with the input data. For one, I am planning to play with this data using SAS VDMML to see if it is possible to improve the quality of the xG model.
One thing I love in football is the possession value models (EPV). I’m hoping to find some time to work on modeling the possession value so that it can help us understand which positions on the pitch are better to stay in when your teammate has the ball. We know that staying too close to your teammate is a bad, but if you stay too far you’ll miss plenty of good opportunities. This is what I’m getting excited about: it is possible to develop a model and find optimal places to be on the pitch when you have the ball as well as when your opponent has the ball.
Last words
I am glad to have taken the chance to have worked with Rocket League replay data as it proved to be a very useful exercise for me to learn the ins and outs of building predictive models. It was funny that we were playing our Rocket League matches and then rushing the data into our Docker container to generate stats. Arguably, checking our xG results and discussing over them with the help of data was more fun than playing the game. :)
These types of descriptive analyses are certainly useful for professional teams, but I think that prescriptive models will give us the edge we all desire in sports. Knowing what happened and the impact of different actions allow us to read future positions better. I am genuinely excited for the role optimization and prescriptive analytics will play within sports.
Some resources about xG
- Does xG really tell us everything about team performance?
- Do Naive xG Models underestimate Expected Goals for Top Teams?
- Should you write about real goals or expected goals? A guide for journalists.
Based on manager ratings on expected points by FPL Review. ↩︎
In terms of technical attributes such as top speed and acceleration, cars are the same. There are differences in terms of hitboxes. ↩︎
Ranked 2v2 games over Platinum 3 level. There are casual and ranked game modes and we focused on ranked games. ↩︎
The combined shot file is around 1GB in size. You can reach out to me if you are interested to get your hands on the data. I am hoping to make the data available on Kaggle soon. ↩︎
We have tried a few different predictive models, including logistic regression, neural network and XGBoost. See details here. We were using only “shots” that
carballpackage has detected earlier, but realized that we also have too many “non-shot goals”, so we included all hits. ↩︎Probability of scoring
kgoals out ofNshots with given xG values give “Poisson Binomial distribution”. See StackExchange for calculating the PMF. ↩︎
